

Travelcard Analysis System based on Rapidis Transit Analyst for ArcGIS
The Travelcard Analysis System, a working system at Movia (Movia is the Regional Transit Authority for the Copenhagen and the Region of Zealand Region) is based on the Rapidis Transit Analyst for ArcGIS software and Esri ArcGIS Enterprise, that Rapidis deliver as an integrated solution.
The many examples on analysis below are shown with kind consent of Movia. See how Movia presented the early vision at the Esri Transportation Summit 2018 in London.
Select Scenario/Time Period for Analysis
When new travel card data and counts are available, it is useful to run a new scenario and create a new estimated OD matrix describing all trips; end to end and with all shifts
Difference Map, B&A Metro City Circle

Map illustrating differences in numbers of boarders and passenger volume for bus lines and rail lines before and after opening the new Copenhagen Metro City Circle line
About the Travelcard Analysis System
The Travelcard Analysis System implemented at Movia is based on Rapidis Transit Analyst for ArcGIS and Esri ArcGIS Enterprise, that Rapidis deliver as a combined solution.
The model provides a new and very accurate picture of customers’ overall use of public transport in the Movia area.
Copenhagen before the Metro City Circle
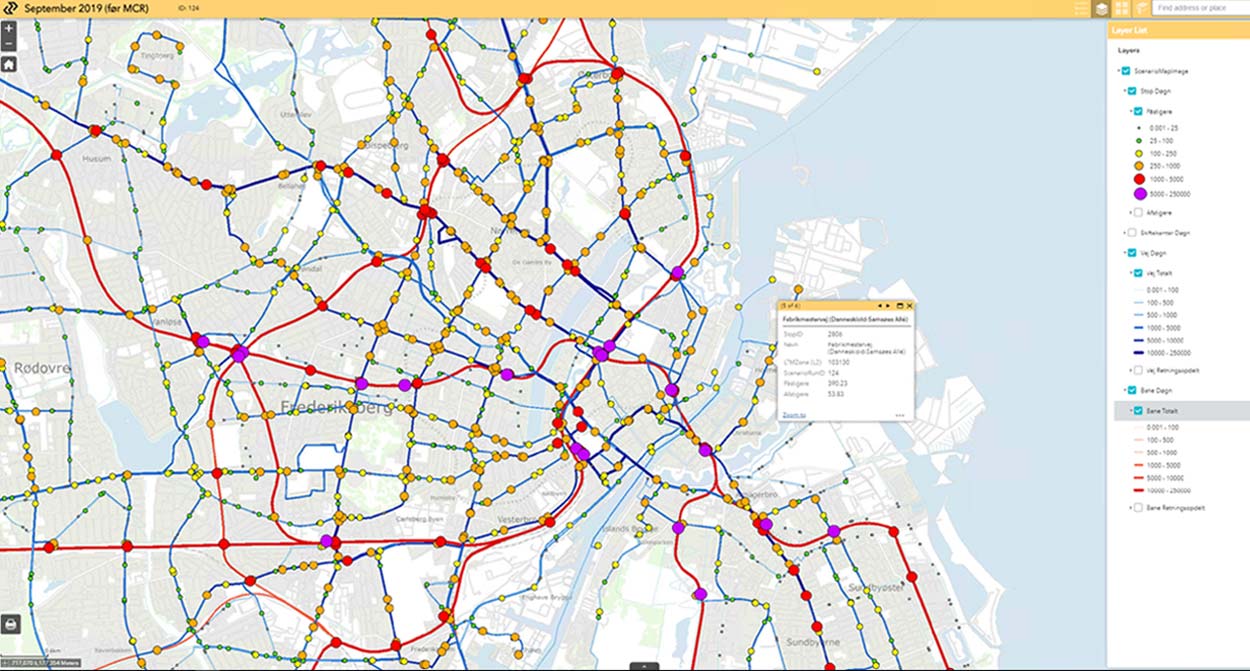
Analysis based on travel card data and counts. The map illustrates the number of boarders and passenger volume for bus line and rail lines, before opening the Metro City-Ring
Copenhagen after the Metro City Circle

Travel card data and counts analyzed in November 2019 after opening the Metro City Circle. The map illustrates significant changes in boarders and passenger volume for bus lines, Metro and rail lines
More than passenger counts
For a specific stop or station counts show numbers for boarders and disembarkment.
Transit Analyst maps the entire trip and shows relations between boarding and disembarkment for all
Shift patterns illustrated on a map

This map illustrates shift patterns at Station Nørreport for November 2019. All information for every stop is available which is used to optimize corresponding lines and modes
Shift patterns in a table

Detailed information for shift patterns are available in a table
lines and modes involved in a trip representing the need for transportation for a given passenger.
Calculate effects from proposed changes
Therefore it is now possible to map and understand how passengers are using the public transit system, what trips will be affected by proposed changes and forecast how passengers affected will change their trip in order to meet their need for transportation.
With this data it is simple to understand which lines, stops etc. will increase or decrease in passenger volume and other metrics.
Municipalities and cities of destination

Here all trips, within the time frame, are analyzed to show the Municipality of destination
Utilization of capacity and seats

Analysis shows, for every busline, how general capacity and the number of seats are utilized
Input for model calculations
Transit Analyst uses Multi-Path OD-Matrix Estimation (MPME) to join modeldata, time tables, counts and travel card data, to provide the best possible both complete and very detailed picture of all trips in the public transit system.
Output describes, in detail, every trip from embarkment to disembarkment for an average day within a category and within the selected time frame.
Input for the MPME is travel card data, available counts and journey plans. Together with the Rapidis Route
Travelers by length of trip

This analysis shows the total number of passengers by length intervals together with average number of shifts and travel time per interval
Catchment area for an education center

This map illustrates the catchment area for ZBC educational center in the city of Slagelse and reveals where the passengers have begun their journey
Choice Model for Public Transit these are the input for the model calculations.
Output from model calculations
Output is an estimated OD-Matrix which is validated with count until it reaches close to 100 % correctness.
Output also provide trips and GIS data for visualization.
Boarders per bus line for a municipality

This analysis will show, for a given municipality in the service area, the number of boarders per bus line
Trips using bus line 500S

This map provides an overview of trips for which bus line 500S has been used for either part of the trip or the entire trip
More info about the Travelcard Analysis System
Please contact Leif Dahl Petersen for more information
Changes in journey plans and routes

Transit Analyst for ArcGIS offers a module to analyze consequences of proposed changes in stops, frequencies and routes before implementing. The potential changes are created in this module without any interference with production systems
Proposed changes created on a map

A proposed new scenario can be created either in a table or by drawing a new line on the map