


Transit Trip Patterns
The first step, which also forms the basis for analysis and scenario simulations is the production of trip patterns.
Transit agencies typically have access to some mix of passenger count data, ticket sales data, travel card data, etc., which all provide information about passenger activity. Counts provide valuable information about total passenger volumes at specific locations, but nothing about which passengers are being counted or the origin or destinations of these passengers.
Travel card data, on the other hand can provide very detailed insights into a certain segment of transit rider activity – but frequently no information about total volumes.
Transit Analyst can help to overcome such limitations by using multiple data sources intelligently to produce a combined and detailed database, which provides a detailed description of all aspects of passengers’ trips.
This is accomplished by using a passenger route choice model, which simulates all trips is the transport system and automatically calibrates the simulation to fit all of the observed data.
In addition to very detailed total ridership data, the database of passenger trips also provides very detailed descriptions of all individual trips generated in the modelling system. This data is easy to analyze and visualize and is a very valuable data foundation for agency planners.
Scenario analysis from service changes
When a provider of public transport considers service changes, it can be both useful and productive to have access to quick assessment of the consequences of such changes for passengers. This enables a conversation with customers and other stakeholders, which is based on sound and well-established modelling principles. Transit Analyst provides detailed key figures and reliable answers to what service changes will mean for travelers.
It is very straightforward to use the travel patterns as the foundation for investigating different scenarios.
Scenarios can easily be created as variations of an existing timetable. Once a scenario has been loaded to the system, passenger flows and travel times can be calculated and key figures and maps examined and compared with other scenario calculations and travel patterns to show consequences for the passengers of proposed service changes.
Transit Analyst for ArcGIS also has features like:
- Detailed and summarized results
- Many standard features / analyses
- Integration with production systems
Accessibility and mobility within public transport
Accessibility analysis can determine how easy it is for a passenger to travel from one area to all other areas. Accessibility is measured in travel time and number of necessary changes.
The results from the analysis can be presented in tabular format or they can be visualized on corresponding maps.
Input data for the accessibility analysis is public transport timetables. These can be reused from travel pattern analysis, from scenario analysis, imported from agency scheduling database or from GTFS format.
When considering a potential timetable change, an agency can code this as a scenario and easily visualize consequences for passengers using difference maps.
The accessibility analysis can be augmented by combing the travel time based accessibility measures with the number of potential passengers by adding population data to the analysis.
Modelling mode choice
When planning more significant service changes it may be necessary to introduce a more advanced public transport model which also includes mode choice between public transport and other modes like driving.
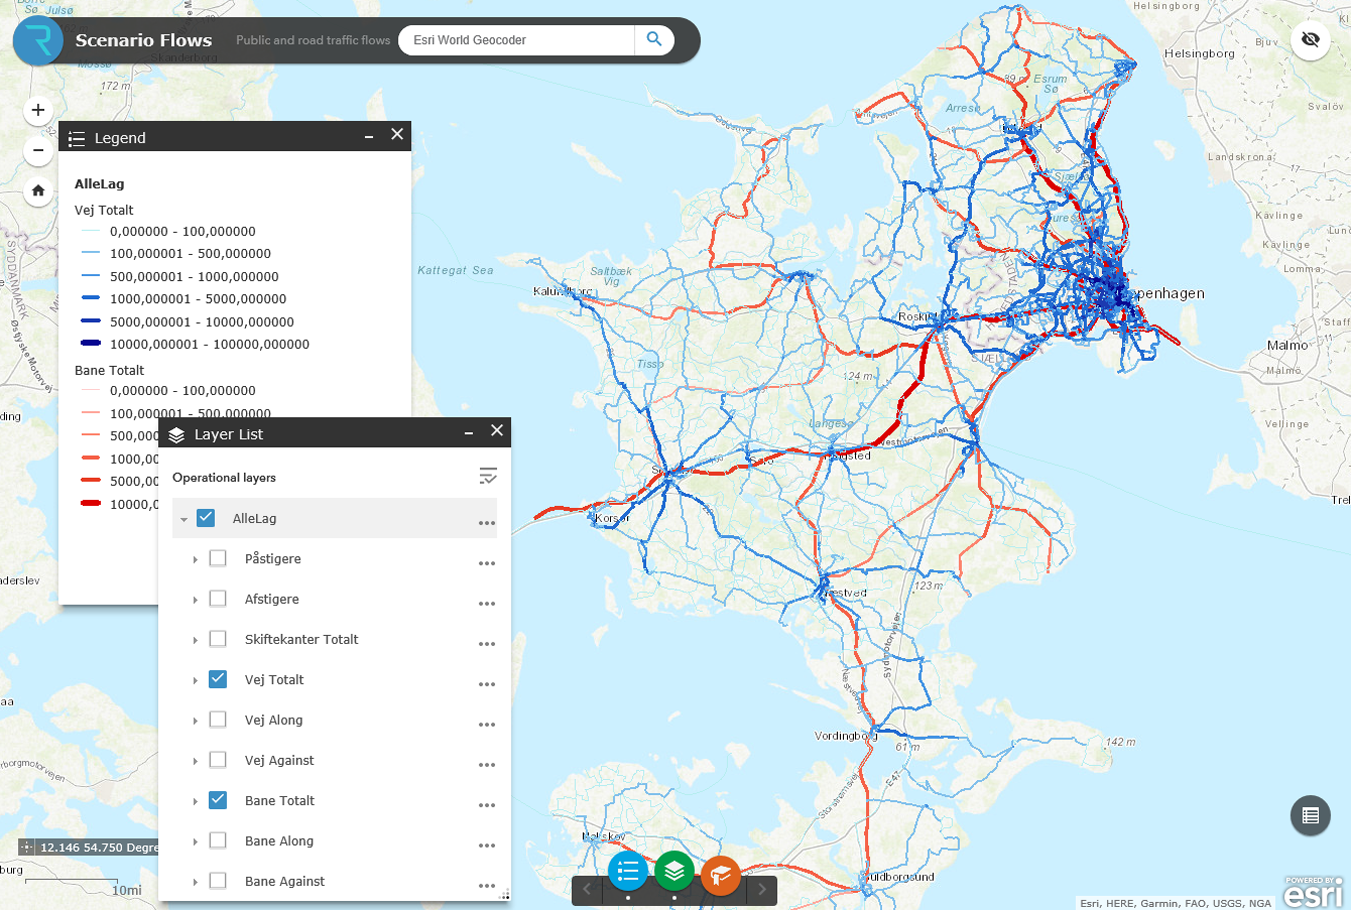
Easy access to results and analysis with the web presentation module
For easy access to scenarios and analyses, Rapidis offers a web presentation module that allows users, from a browser, to access the Transit Analyst modules used by their organization.
The web module is flexible and offers:
- Access to all scenarios and results
- Easy interactive analyses
- Key figures and maps
- Automated visualization of differences in results
- Start and monitor calculations in web module
- Easy access for all members of the organization
For moreinformation please contact Leif Dahl Petersen